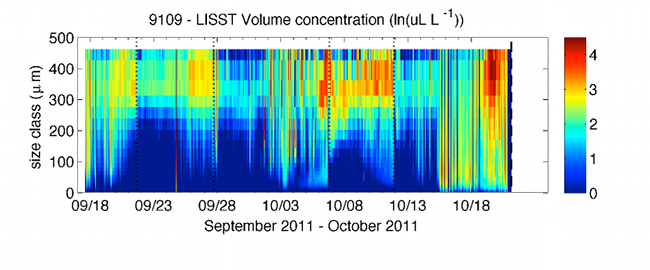
Figure 49. Graph showing time series of volume concentration for 32 size classes from the LISST-100X mounted on profiling arm. Dashed line marks time when tripod tipped over by strong waves and currents. Dotted lines mark times when optical sensors were cleaned by divers. Refer to the Abbreviations and Symbols section.