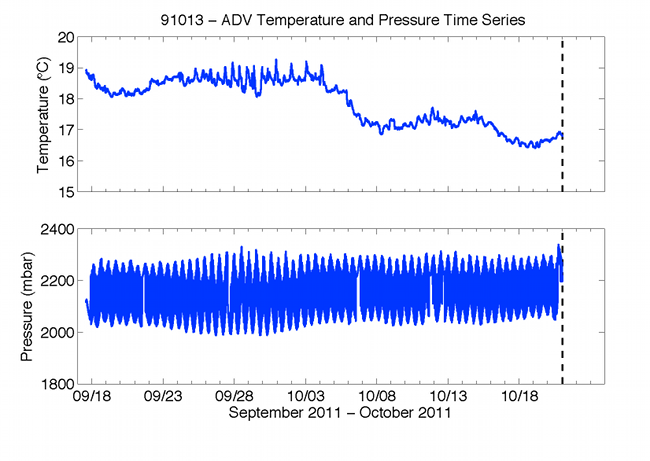
Figure 57. Graphs showing time series of 1-minute median temperature and pressure. Temperature data are from the blue ADV and pressure data are from a Paros pressure sensor; both devices were mounted on profiling arm. Dashed line marks time when tripod tipped over by strong waves and currents. Refer to the Abbreviations and Symbols section.