During the 4-month instrument
deployments, the systems were affected by biological and occassionally
mechanical fouling. Different organisms of varying densities appeared
on surfaces at different depths (figure 22). Biological fouling was typically heaviest on the near-surface
instruments and less on the near-bottom instrumentation.
All surfaces of the tripod
frames, current sensors, and some instrument cases were painted with antifouling
paint (Pettit Marine Paint Trinidad Anti-fouling, Cuprous Oxide 65%, Inerts
35%, EPA regulation #60061-49).
In general, this was effective at minimizing
fouling over the 4-month deployment, but not always
(figure 23A,
23B,
23C). The
current data files have been truncated when the data begin to be affected
by fouling.
The optical windows of the
cameras (figure 24)
and transmissometers were almost always affected by some biological growth
after a 4-month deployment. Beginning in 1991, the windows of the transmissometers
were surrounded by a porous plastic ring impregnated, using a vacuum technique,
with Controlled Environmental Chemical Antifouling Protection (
CECAP,
manufactured by Oceanographic Industries) which contains trialkyltin
(Strahle and others, 1994). The toxin slowly leached into the water in front
of the transmissometer window to retard the growth of barnacles. Between
deployments, the ring was cleaned and a new amount of
CECAP was impregnated
into the material. Although this protection discouraged macrofaunal growth
and length of time that good data were obtained (Strahle
and others, 1994), accumulation of algal slime on the transmissometer
windows continued to gradually block light transmission, resulting in
a gradual upward drift of the beam attenuation coefficient. The
beam attenuation data have not been corrected for biological fouling and
should be interpreted with care. |
The following figures are in PDF format.
Figure 22
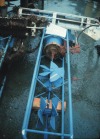
Figure 23A
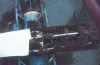
Figure 23B
Figure 23C
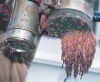
Figure 24
Figure 25
|
The ports for all of the
conductivity cells (on SEACAT's, MicroCAT's, and on the bottom tripod
systems) were fitted with hollow porous plastic tips impregnated with
trialkyltin, to reduce fouling (Oceanographic Industries). Salinities
measured by the bottom tripod systems between 1989 and 1996 were erroneously
low by as much as 1psu by the end of the 4-month deployment. Salinities
have not been corrected for these errors. The conductivity cells
were apparently affected by a slow, gradual buildup of a biological film
on the electrodes and also occasional sudden deposits of material (possibly
sediments) inside the measurement volume of the conductivity cell. In
June 1996 (mooring 470), Seabird pumps were added to the bottom tripod
system to flush the conductivity cell prior to making a measurement, reducing
the effect of deposits on the conductivity measurements. The conductivity
cells mounted on the subsurface mooring were hypothesized to be less sensitive
to the buildup of sediments because of the stronger currents and vibration
of the mooring.
Occasionally, the bottom tripod
tipped over during the course of a deployment (Tripod mooring 407 tipped
over on November 18, 1992, at about 1500 and tripod mooring 428 tipped
over on November 16, 1993, at about 1600). When recovered, mooring 407
was entangled with lobster gear (figure
25). This recovery followed the intense December 1992 storm during
which a large amount of lobster gear was lost; it is hypothesized that
some of this drifting gear became entangled on the tripod.
 To view files in PDF format, download free copy of Adobe Reader. To view files in PDF format, download free copy of Adobe Reader. 


|