Instruments to measure current, temperature, salinity, bottom pressure, light transmission,
suspended matter, and to photograph the sea floor were deployed at Site A from 1989
to 2002. Instruments to measure current, temperature, and suspended matter
were deployed at Site B from 1997 to 2002.
In addition to the time-series physical observations, sediment traps were deployed
at both Sites A and B. The data they collected are used to estimate the relative amount of
suspended sediment falling through the bottom water, to link variations
in the trapping rate with changes in oceanographic conditions, and to
determine the chemical and physical properties of the trapped sediment.
Traps collected samples during storm and non-storm periods and during
seasonal cycles in primary productivity, providing information on the
nature and amounts of material in transport under different oceanographic
conditions. The sample suite was also designed to monitor changes in contaminant
concentrations of trapped material since 1989 and especially since the
start of the Massachusetts Bay Outfall. Outfall-related changes in chemistry
are expected to be detected earlier and more intensively in trapped suspended
sediment than in the surficial bottom sediments because trapped sediments
are immediately isolated by the sampling device. In contrast, particles
falling on the sea floor can be mixed downward by benthic organisms and
diluted by older particles from below the water-sediment interface.
Instrumentation was recovered
and replaced at each site 3 times each year (typically in February, June,
and September). The moorings at Site A and Site B were deployed and recovered
using the U.S. Coast Guard Cutter White Heath
(figure
3A) between 1989 and 1998, and the U.S. Coast Guard Cutter Marcus
Hannah between 1998 and 2002 (
figure
3B). Additional instrument deployments and recoveries in emergencies
and gear testing were accomplished using the fishing vessel Christopher
Andrew (figure 3C).
Site A
The location of the long-term Site A (42° 22.6' N. 70° 47.0' W.) is 13
km east of the entrance to Boston Harbor,
at a water depth of about 33
m (
figures 1, 4).
Because this is an area of heavy marine activity, the instruments were
deployed adjacent to the USCG Boston Approach B Buoy to mark
the site and to provide some protection from accidental disruption. Instruments
were deployed to measure near surface, near bottom, and bottom currents
and water properties. During the 13-year period that instruments have
been deployed at this site, three configurations of instruments have been
used. Deployments of the surface, subsurface, and bottom moorings at Site
A were clustered within about a 500-m circle to the south of the
USCG
buoy B (figure 4). The
sea floor at Site A is gravel (figure
5A, B)
1989 - 1994
(figures 6A,
6B, and
6C)
During this period, the Boston
Approach B buoy was a large 40-foot discus buoy capable of supporting
oceanographic instrumentation. A vector measuring current meter (VMCM),
a transmissometer, and a SEACAT temperature and salinity sensor were suspended
at a depth of 5 m below the surface from the Large Navigational Buoy.
A second VMCM,
transmissometer, and SEACAT were deployed 10 m above bottom
(or about 23 m from the surface) on a taut subsurface
current mooring.
A bottom tripod system that measured current, temperature, salinity, light
transmission, and pressure was deployed on the sea floor. Instruments
mounted on the tripod also measured dissolved oxygen, photographed the
sea floor, and sampled suspended sediment during selected events. A time
series sediment trap at 5 m above bottom (about 28 m from the surface)
collected sediments for successive 9-day intervals.
1994 - 1996
(figure 7A
and 7B)
In 1994, the 10-m Large Navigation
Buoy (LNB) was discontinued and replaced
with a smaller buoy
that would not support deployment of the near-surface
VMCM.
A small surface mooring was maintained to allow current measurements 5
m below the surface, and a subsurface mooring was used
to obtain measurements
at 10 m above the bottom. In addition,
Acoustic Doppler Current Profiler
(ADCP) measurements were initiated at Site A. The ADCP
provided measurements of current from about 6 mab (meters
above bottom) to about 5 mbs (meters below surface) in 2-m
bins. The ADCP was initially deployed on a small tripod frame
(figure 13C) between
1994 and 1996, then on the large tripod frame beginning in 1997.
1997 - 2002
(figure 8A
and 8B)
In 1997, the surface mooring
was discontinued, and near-surface temperature and salinity measurements
were obtained from instruments mounted on the top of the subsurface float
about 7 m below the surface. Acoustic Doppler Current
Profiler (ADCP)
measurements were transferred to the large tripod maintained at Site A.
The subsurface mooring collected temperature and conductivity about 7
mbs, measured currents
(VMCM), temperature, and conductivity at 10
mab,
and held a time-series sediment trap 4 mab. |
The following figures are in PDF format.
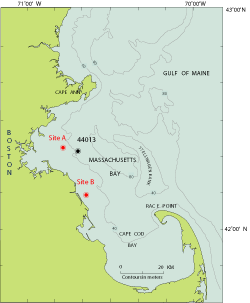
Figure 1

Figure 3A

Figure 3B

Figure 3C

Figure 4

Figure 5A

Figure 5B

Figure 6A

Figure 6B
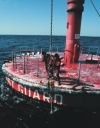
Figure 6C

Figure 7A

Figure 7B

Figure 8A
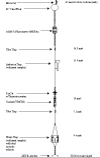
Figure 8B

Figure 9A

Figure 9B
Figure 10

Figure 11A
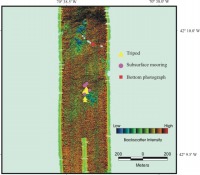
Figure 11B

Figure 12
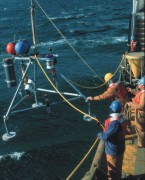
Figure 13C
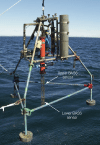
Figure 13D
|


