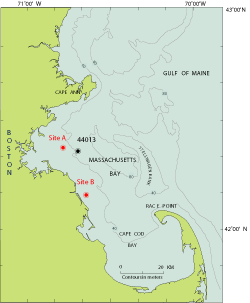
| This data report presents long-term oceanographic observations made in western Massachusetts Bay
at two locations: (1) 42° 22.6' N., 70° 47.0' W. (Site A, 33 m water depth)
from December 1989 through December 2002 (figure 1),
and (2) 42° 9.8' N., 70° 38.4' W. (Site B, 21 m water depth) from October 1997
through December 2002. Site A is approximately 1 km
south of the
new ocean outfall that began discharging treated sewage effluent from
the Boston metropolitan area into Massachusetts Bay on September 6, 2000.
These long-term oceanographic observations have been collected by the
U.S. Geological Survey (USGS)
in partnership with the
Massachusetts Water
Resources Authority (MWRA)
and with logistical
support from the U.S. Coast Guard (USCG -
http://www.uscg.mil). This report presents time series data through December 2002, updating a
similar report that presented data through December 2000 (Butman and others, 2002). In addition, the
Statistics and Mean Flow sections include
some new plots and tables and the format of the report has
been streamlined by combining yearly figures into single .pdfs. |

Figure 1 (PDF format) |
The long-term measurements
are planned to continue at least through 2005. The long-term oceanographic
observations at Sites A and B are part of a
USGS study
designed to understand the transport and long-term fate of sediments and
associated contaminants in the Massachusetts bays.
(See http://woodshole.er.usgs.gov/project-pages/bostonharbor/
and Butman and Bothner, 1997.) The long-term observations document seasonal
and inter-annual changes in currents, hydrography, and suspended-matter
concentration in western Massachusetts Bay, and the importance of infrequent
catastrophic events, such as major storms or hurricanes, in sediment resuspension
and transport. They also provide observations for testing numerical models
of circulation.
This data report presents
a description of the field program and instrumentation, an overview of
the data through summary plots and statistics, and the data in
NetCDF and ASCII format for the period December 1989 through December 2002
for Site A and
October 1997 through December 2002 for Site B. The objective of this report
is to make the data available in digital form and to provide summary plots
and statistics to facilitate browsing of the long-term data set.
|


