|
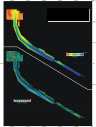
Multibeam Bathymetric and Backscatter Maps of the Upper Hudson Shelf Valley and Adjacent Shelf, Offshore of New York
Results
The results of this report are presented within the pages listed below and in Figures 1-10
Overview
Recent Historical Disposal Sites
Dredged Material Disposal Site
Evidence for Dumping
Striping of Data
Outcropping Beds of Coastal Plain Strata
Sand Waves
Hudson Shelf Valley
Click on figures below for larger images with captions
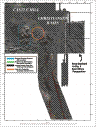
Figure 1, Figure 3 and Figure 4 contain a 3D prespective view of the northern portion of the study region and overview maps of the bathymetry and backscatter intensity of the entire Hudson Shelf Valley surveyed to date. |
| |
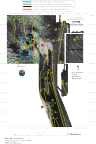
Figure 5, Figure 6, and Figure 7 present the observations north of 40° 14' N. Figures 5 and Figure 6 are maps of the bathymetry and backscatter intensity at a scale of 1:25,000. Figure 7 is at 1:12,500. |
|
|
|
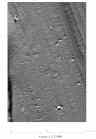
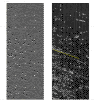
Figures 7-10
contains maps of selected features at a scale of 1:12,500. |
| |
|
Based on Butman, B., Danforth, W.W., Schwab, W.C., and Buchholtz ten Brink, M.B., 1998, Multibeam Bathymetric and Backscatter Maps of the Upper Hudson Shelf Valley and Adjacent Shelf, Offshore of New York: U.S. Geological Survey Open-File Report 98-616. |
Web page by: Donna Newman
[an error occurred while processing this directive]
|
|