Skip header
 Identifier symbol and link to USGS Home page
Oceanographic Observations, Hudson Shelf Valley, U.S. Geological Survey Open-File Report 02-217

Hydrographic Data


Hydrographic observations were collected on the deployment and recovery cruises for the moored array.

RV Oceanus
(December 5-7, 1999)

RV Endeavor
(April 15, 2000)

RV Oceanus

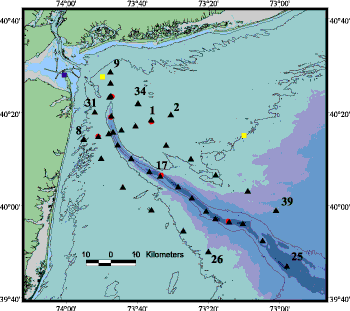
Map of Oceanus cruise cast locations.

Map showing location of CTD casts on RV Oceanus cruise, December 5-7, 1999.

Suspended sediment samples

Plot of concentration of suspended material (from filtered water samples) vs. OBS voltage. See table for concentrations and OBS values.

Plot of concentrations of suspended material (from the filtered water samples) vs. beam attenuation (computed from transmission). The linear regression is fit through all data points and for points 5 mab or less. See table for concentrations and beam attenuation values.

Sections of water properties as a function of depth and distance

Along-Valley transect (casts 9-25):
Temperature
Salinity Sigma T Fluorescence Beam Attenuation OBS

East shelf transect (casts 33, 34, 1, 35-39):
Temperature
Salinity Sigma T Fluorescence Beam Attenuation OBS

West shelf transect (casts 7, 30-26):
Temperature
Salinity Sigma T Fluorescence Beam Attenuation OBS

Across-valley transect (casts 1, 2, 3-8):
Temperature
Salinity Sigma T Fluorescence Beam Attenuation OBS

Waterfall plots superimposing all casts for each variable:

Temperature Salinity Sigma T Fluorescence Beam Attenuation OBS

Plots of variables for each station:

PDF with all plots OC354all.pdf


Temperature, Salinity, and Sigma T Beam Attenuation and Fluorescence
1 OC001_TS.pdf OC001_opt.pdf
2 OC002_TS.pdf OC002_opt.pdf
3 OC003_TS.pdf OC003_opt.pdf
4 OC004_TS.pdf OC004_opt.pdf
5 OC005_TS.pdf OC005_opt.pdf
6 OC006_TS.pdf OC006_opt.pdf
7 OC007_TS.pdf OC007_opt.pdf
8 OC008_TS.pdf OC008_opt.pdf
9 OC009_TS.pdf OC009_opt.pdf
10 OC010_TS.pdf OC010_opt.pdf
11 OC011_TS.pdf OC011_opt.pdf
12 OC012_TS.pdf OC012_opt.pdf
13 OC013_TS.pdf OC013_opt.pdf
14 OC014_TS.pdf OC014_opt.pdf
15 OC015_TS.pdf OC015_opt.pdf
16 OC016_TS.pdf OC016_opt.pdf
17 OC017_TS.pdf OC017_opt.pdf
18 OC018_TS.pdf OC018_opt.pdf
19 OC019_TS.pdf OC019_opt.pdf
20 OC020_TS.pdf OC020_opt.pdf
21 OC021_TS.pdf OC021_opt.pdf
22 OC022_TS.pdf OC022_opt.pdf
23 OC023_TS.pdf OC023_opt.pdf
24 OC024_TS.pdf OC024_opt.pdf
25 OC025_TS.pdf OC025_opt.pdf
26 OC026_TS.pdf OC026_opt.pdf
27 OC027_TS.pdf OC027_opt.pdf
28 OC028_TS.pdf OC028_opt.pdf
29 OC029_TS.pdf OC029_opt.pdf
30 OC030_TS.pdf OC030_opt.pdf
31 OC031_TS.pdf OC031_opt.pdf
32 OC032_TS.pdf OC032_opt.pdf
33 OC033_TS.pdf OC033_opt.pdf
34 OC034_TS.pdf OC034_opt.pdf
35 OC035_TS.pdf OC035_opt.pdf
36 OC036_TS.pdf OC036_opt.pdf
37 OC037_TS.pdf OC037_opt.pdf
38 OC038_TS.pdf OC038_opt.pdf
39 OC039_TS.pdf OC039_opt.pdf

Jump to top of page

RV Endeavor

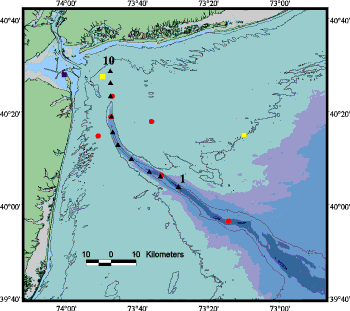
Map of Endeavor cruise cast locations.

Map showing location of CTD casts on RV Endeavor cruise, April 15, 2000.

Suspended sediment samples

- Plot of concentrations of suspended material from the filtered water samples vs. beam attenuation. The linear regression is fit through all data points and for points 5 mab or less. See Table for sample locations and concentrations.

Sections of water properties as a function of depth and distance along the Hudson Shelf Valley:

Temperature Salinity Sigma T Fluorescence Beam Attenuation

Waterfall plots superimposing all individual casts for each variable:

Temperature Salinity Sigma T Beam Attenuation Fluorescence.

Plots of variables for each station:

PDF with all plots: CTDall.pdf

  Temperature, Salinity, and Sigma T Beam Attenuation and Fluorescence
1 CTD01_TS.pdf CTD01_opt.pdf
2 CTD02_TS.pdf CTD02_opt.pdf
3 CTD03_TS.pdf CTD03_opt.pdf
4 CTD04_TS.pdf CTD04_opt.pdf
5 CTD05_TS.pdf CTD05_opt.pdf
6 CTD06_TS.pdf CTD06_opt.pdf
7 CTD07_TS.pdf CTD07_opt.pdf
8 CTD08_TS.pdf CTD08_opt.pdf
9 CTD09_TS.pdf CTD09_opt.pdf
10 CTD10_TS.pdf CTD10_opt.pdf

Figure 3. Locations of Conductivity-Temperature-Depth stations made December '99 on RV Oceanus. Figure 3

Figure 4. Locations of Conductivity/Temperature Depth stations made April '00 on RV Endeavor.
Figure 4

Jump to top of page

Go to previous page.     Go to next page.

To view files in PDF format, download free copy of Adobe Acrobat Reader (www.adobe.com/products/acrobat/alternate.html).


Skip footer information
Title Page / Contents / Tables / Figures / Abbreviations / Introduction / Field Program / Observations / Instrumentation / Data Processing / Fouling / Mooring/Data File ID / Results / Digital Data / Acknowledgements / References / Matlab / Supplementary / Metadata
[an error occurred while processing this directive]