 |
Figure 1. Location of the combined multibeam echosounder dataset for Block Island Sound, offshore Rhode Island, released in this report (blue polygon). Also shown are the extent of the data collected by the Massachusetts Mapping Cooperative (dashed red line; Barnhardt and Andrews, 2006; Ackerman and others, 2012) and the locations of other surveys by the National Oceanic and Atmospheric Administration Ships Thomas Jefferson and Rude off Rhode Island for which digital reports containing geological interpretations have been completed (light gray polygons). These surveys and their respective reports include: H11310—McMullen and others (2007a); H11320—McMullen and others (2007b); H11321—McMullen and others (2008); H11322—McMullen and others (2009a); H11996—McMullen and others (2011); H11922—Poppe and others (2011); and H11995—McMullen and others (2012). |
 |
Figure 2. Map showing extents of the individual National Oceanic and Atmospheric Administration hydrographic surveys used to create the combined multibeam echosounder dataset for Block Island Sound released in this report. These surveys include H12009, H12010, H12011, H12015, H12033, H12137, and H12139. Also shown are prominent local physiographic features. |
 |
Figure 3. Segment of Uniboom seismic-reflection profile collected across a part of Block Island Sound (RV Asterias 81-2, line 10; Needell and Lewis, 1984). Profile shows that (1) marine, fluvial, and estuarine deposits are thin or absent in the northern part of the study area, but thicken southward on the floor of the sound, (2) glaciolacustrine sediments comprise most of the sedimentary section, and (3) outliers of coastal plain cap some of the bedrock highs. Location of seismic profile is shown in figure 18. |
 |
Figure 4. Map, modified from Stone and Borns (1986) and Gustavson and Boothroyd (1987), showing locations of end moraines (black polygons) in southern New England and on Long Island, New York. The Ronkonkoma-Nantucket moraine marks the Laurentide Ice Sheet's southern extent at glacial maximum about 20-24 kyBP, and the Harbor Hill-Roanoke Point-Charlestown-Buzzards Bay moraine represents the ice sheet position after a readvance around 18 kyBP (Uchupi and others, 1996). Underwater extensions of the moraines are shown as dashed lines. |
 |
Figure 5. Port-side view of the National Oceanic and Atmospheric Administration Ship Thomas Jefferson at sea. Note that the 30-foot survey launch normally stowed on this side of the ship has been deployed. |
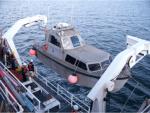 |
Figure 6. Image showing launch 3102 being deployed from the National Oceanic and Atmospheric Administration Ship Thomas Jefferson. |
 |
Figure 7. Starboard-side view of the National Oceanic and Atmospheric Administration launch 3102 at sea. |
 |
Figure 8. The RESON Seabat 8125 multibeam echosounder hull-mounted to National Oceanic and Atmospheric Administration launch 3101. |
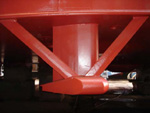 |
Figure 9. The RESON 7125 multibeam echosounder hull-mounted to the National Oceanographic and Atmospheric Administration Ship Thomas Jefferson. |
 |
Figure 10. Brooke Ocean Technology Moving Vessel Profiler with a Sea-Bird Electronics, Inc., conductivity-temperature-depth (CTD) profiler used to correct sound velocities for the multibeam data. |
 |
Figure 11. Sea-Bird Electronics, Inc., SEACAT conductivity-temperature-depth (CTD) profiler. Data derived from frequent deployments of this device were used to correct sound velocities for multibeam data collected aboard the launches. |
 |
Figure 12. Image shows a port-side view of the U.S. Geological Survey (USGS) RV Rafael that was used to collect bottom photography and sediment samples during USGS cruise 2011-006-FA. |
 |
Figure 13. View of the small SEABOSS, a modified Van Veen grab equipped with still and video photographic systems, mounted on the aft starboard side of the RV Rafael. Note the winch mounted on the davit (left) and the take-up reel for the video-signal and power cable (right). |
 |
Figure 14. Map showing the station locations used to verify the acoustic data with bottom sampling and photography in Block Island Sound during U.S. Geological Survey cruise 2011-006-FA. |
 |
Figure 15. Correlation chart showing the relationships between phi sizes, millimeter diameters, size classifications (Wentworth, 1922), and ASTM and Tyler sieve sizes. Chart also shows the corresponding intermediate diameters, grains per milligram, settling velocities, and threshold velocities for traction. |
 |
Figure 16. Sediment classification scheme from Shepard (1954), as modified by Schlee (1973) and Poppe and others (2004). |
 |
Figure 17. Digital terrain model (DTM) of the sea floor produced from the combined multibeam bathymetry collected during National Oceanic and Atmospheric Administration surveys H12009, H12010, H12011, H12015, H12033, H12137, and H12139 in Block Island Sound, offshore Rhode Island. Image is sun-illuminated from the north and vertically exaggerated 5x. Warmer colors are shallower areas; cooler colors are deeper areas. See key for depth ranges. |
 |
Figure 18. Locations of detailed planar views of the digital terrain model (yellow polygons), Uniboom seismic-reflection profile shown in figure 3 (red line), bathymetric profiles of bedform morphology shown in figures 34 and 35 (dark green lines A-D), and directions of net sediment transport (blue arrows) inferred from bedform morphology. |
 |
Figure 19. Detailed planar view of the combined National Oceanic and Atmospheric Administration surveys in Block Island Sound showing the bouldery sea floor off the eastern shore of Block Island and the location of station BIS83. Boulders are a lag deposit from the 20-24 kyBP Ronkonkoma-Nantucket end moraine. Location of view is shown in figure 18. |
 |
Figure 20. Detailed planar view of the combined National Oceanic and Atmospheric Administration surveys in Block Island Sound showing the bouldery sea floor off the western shore of Block Island and the location of station BIS41. Note the channels presumably formed by tidal currents deflected offshore by a boulder ridge. Location of view is shown in figure 18. |
 |
Figure 21. Detailed planar view of the combined National Oceanic and Atmospheric Administration surveys in Block Island Sound showing a submerged section of the Ronkonkoma-Nantucket end moraine, adjacent sand waves, and the locations of stations BIS34 and BIS35. Note that sand wave asymmetry, where present, indicates net northward sediment transport in this area. Location of view is shown in figure 18. |
 |
Figure 22. Detailed planar view of the combined National Oceanic and Atmospheric Administration surveys in Block Island Sound showing the bouldery sea floor southeast of Point Judith and the location of station BIS65. Boulders are a lag deposit from the circa 18 kyBP Point Judith moraine. Location of view is shown in figure 18. |
 |
Figure 23. Map showing the distribution of interpreted sea-floor features in Block Island Sound. Features include sand waves and megaripples, boulders, storm-induced scour, and shipwrecks. Blank areas of the study area are primarily Holocene marine deposits. |
 |
Figure 24. Detailed planar view of the combined National Oceanic and Atmospheric Administration surveys in Block Island Sound showing storm-wave induced scour on the flanks of the bathymetric high southeast of Point Judith and the locations of stations BIS62 and BIS63. Note the relatively flat, featureless appearance of the surrounding seabed composed of Holocene marine sediments, the boulders on the floor of the depressions, and the presence of outliers. Location of view is shown in figure 18. |
 |
Figure 25. Detailed planar view of the combined National Oceanic and Atmospheric Administration surveys in Block Island Sound showing storm-wave induced scour on the flanks of the bathymetric high along the southeastern edge of the study area. Note the relatively flat, featureless appearance of the surrounding seabed composed of Holocene marine sediments, the boulders on the floor of the depressions, and the presence of outliers of the original sea-floor sediments. |
 |
Figure 26. Schematic showing the depth to which waves can effectively move water and the wave-induced horizontal and vertical stresses that impact the seabed. |
 |
Figure 27. Detailed planar view of the combined National Oceanic and Atmospheric Administration surveys in Block Island Sound showing channels in the western part of the study area and locations of stations BIS22, BIS24, BIS26, BIS27, and BIS28. Note that the channels start in storm-wave induced scour depressions and that the channels merge down slope. Location of view is shown in figure 18. |
 |
Figure 28. Detailed planar view of the combined National Oceanic and Atmospheric Administration surveys in Block Island Sound showing channels in the eastern part of the study area and location of a shipwreck. Note that the channels form dendritic patterns and that the axes of one channel system are shown by white dashed lines. Location of view is shown in figure 18. |
 |
Figure 29. Detailed planar view of the combined National Oceanic and Atmospheric Administration surveys in Block Island Sound showing depressions formed by tidal scour in the passage north of Block Island and locations of stations BIS47, BIS48, BIS49, and BIS50. Note that sand-wave, megaripple, and obstacle-mark asymmetry indicates net sediment transport out of the passage. Location of view is shown in figure 18. |
 |
Figure 30. Detailed planar view of the combined National Oceanic and Atmospheric Administration surveys in Block Island Sound showing a scour depression formed by tidal scour in the southwestern part of the study area and location of station BIS8. Note that sand-wave and obstacle-mark asymmetry indicate northwestward net sediment transport. Location of view is shown in figure 18. |
 |
Figure 31. Detailed planar view of the combined National Oceanic and Atmospheric Administration surveys in Block Island Sound showing large sand waves in the southwestern part of the study area and location of station BIS36. Note that the sand-waves are symmetrical. Location of view is shown in figure 18. |
 |
Figure 32. Detailed planar view of the combined National Oceanic and Atmospheric Administration surveys in Block Island Sound showing barchanoid sand waves in the southwestern part of the study area and location of station BIS10. Note that the sand-wave and obstacle-mark asymmetry indicate northwestward net sediment transport. Location of view is shown in figure 18. |
 |
Figure 33. Detailed planar view of the combined National Oceanic and Atmospheric Administration surveys in Block Island Sound showing a field of barchanoid megaripples in the western part of the study area. Note that the sand-wave asymmetry and orientation of the barchan horns indicate eastward net sediment transport (McKee, 1966). Location of view is shown in figure 18. |
 |
Figure 34. Bathymetric profiles across sand waves and megaripples from the combined National Oceanic and Atmospheric Administration surveys in Block Island Sound from the eastern (profile A) and western (profile B) entrances to the passage north of Block Island. Bedform asymmetry indicates net sediment is out of the passage. Locations of profiles A and B are shown in figure 18. |
 |
Figure 35. Bathymetric profiles across sand waves from the combined National Oceanic and Atmospheric Administration surveys in Block Island Sound from the southwestern part of the study area. Bedforms in profile C are from the top of a shoal and are symmetrical; bedforms in profile D are from the western flank of the shoal and are asymmetrical. Locations of profiles are shown in figure 18. |
 |
Figure 36. Detailed planar view of the combined National Oceanic and Atmospheric Administration surveys in Block Island Sound showing the relatively flat, featureless appearance of the surrounding seabed composed of Holocene marine sediments, a shipwreck, and artifacts from acquisition and processing. Shipwreck is that of a German submarine sunk during World War II. Note the absence of asymmetrical scour around the wreck. Location of view is shown in figure 18. |
 |
Figure 37. Map showing the station locations within Block Island Sound collected during U.S. Geological Survey cruise 2011-006-FA that were used to verify the acoustic data, color coded for sediment texture. Warmer colors are coarser grained sediments; cooler colors are finer grained sediments. |
 |
Figure 38. Distribution of sedimentary environments based on the digital terrain model from combined National Oceanic and Atmospheric Administration (NOAA) surveys H12009, H12010, H12011, H12015, H12033, H12137, and H12139; unpublished NOAA survey H12299 located adjacent to the southwestern corner of the (DTM); and the sampling and photography data from U.S. Geological Survey cruise 2011-006-FA that were used to verify the acoustic data. Areas characterized by processes associated with erosion or nondeposition, coarse bedload transport, sorting and reworking, and deposition are shown. |
 |
Figure 39. Bottom photographs from stations BIS25 and BIS10 showing the sessile fauna that commonly cover boulders in Block Island Sound. Note the presence of hydrozoans, hydroids, anemones, and encrusting sponges, and that juvenile finfish seek shelter among the rocks. Station locations are shown in figures 14 and 37. |
 |
Figure 40. Bottom photographs from station BIS86 showing the sessile flora that commonly cover boulders in high-energy shallow-water environments within Block Island Sound. Note the presence of red seaweed and kelp. Station location is shown in figures 14 and 37. |
 |
Figure 41. Bottom photographs from stations BIS73 and BIS48 showing the gravel sea floor that commonly surrounds bouldery areas and armors the sea floor in higher energy sedimentary environments. Station locations are shown in figures 14 and 37. |
 |
Figure 42. Bottom photographs showing a comparison of the rippled gravelly sand in a scour depression at station BIS85 with the adjacent undulating, muddy sand outside the scour depression at the same station. Sediments within scour depressions are typically coarser than those on the surrounding sea floor in Block Island Sound. Station location is shown in figures 14 and 37. |
 |
Figure 43. Bottom photographs from stations BIS6 and BIS8 showing views of current-rippled sea floor composed of coarse to medium sand. Note the concentration of shell debris and gravel in the ripple troughs. Station locations are shown in figures 14 and 37. |
 |
Figure 44. Bottom photographs from stations BIS3 and BIS5 showing views of faintly rippled to flat sea floor composed of fine-grained sand. Note the patchy distribution of worm tubes and the flounder. Station locations are shown in figures 14 and 37. |
 |
Figure 45. Bottom photographs from stations BIS22 and BIS28 showing views of shell-debris accumulations. Deposits of shell debris in Block Island Sound are typically thin and ephemeral. Station locations are shown in figures 14 and 37. |
 |
Figure 46. Bottom photographs from stations BIS31 and BIS15 showing a view of the flat to undulating, bioturbated sea floor composed of muddy sand typical of those areas of Block Island Sound characterized by processes associated with deposition. Note the presence of worm tubes, and small to large burrows. Station locations are shown in figures 14 and 37. |


