FISC - St. Petersburg
|
Primary Datasets
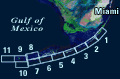
Seismic Profiles—Data Acquisition and Processing: Seismic geophysical data provided the bedrock-surface data and the primary overlying reef and sediment thickness (isopach) data source. More than 300 km of high-quality seismic-reflection profiles were collected in October 1997 (Peery et al., 2002; Fig. 6C) using the proprietary Elics Delphwin high-resolution seismic software (Ver 1.32) with a 32-bit digital signal processor running on a Kontron IP Lite portable PC and Windows 95 operating system. Hardcopy profile data were displayed on an OYO Geospace GS612 gray-scale thermal plotter and SVGA flat-panel monitor. Trackline shotpoints were automatically recorded on the profiles at 1-min intervals. Latitude and longitude from a Global Positioning System (GPS) receiver were simultaneously recorded with each shotpoint. Digital data were saved on an internal 2GB hard drive as well as an Iomega Jaz drive (1GB). GPS navigation data were obtained with a Rockwell PLGR (Precision Lightweight GPS Receiver) using P Code (military) encryption. Navigation data were collected and displayed in real time on an Amrel Rocky laptop running FUGAWI real-time GPS mapping software and Windows 95. The navigation data were also stored and displayed real-time on the Delphwin seismic system. The Elics Delphwin system triggered an ORE Geopulse model 5420A power supply used as a seismic source. The ORE unit contained capacitors and electronic circuits to transmit a pulse of energy to an electromechanical device (acoustical sound source) towed on a catamaran sled. An underwater acoustical pulse was produced each time the device was triggered. Power output was set to either 60 or 135 Joules depending upon conditions and a cycle rate of 10 pulses per second. An Innovative Transducers Inc. ST-5 10-element hydrophone was used to detect the reflected acoustical pulse. The received pulse was fed directly into the Delphwin system for storage and processing. The seismic-profile trackline navigation maps were generated using a commercial geographic information system (GIS) computer software package (CPS-3). The data originated from Excel spreadsheet datasets that included GPS shotpoint coordinate fixes and annotations, trackline names, and depths to the interpreted horizons. The data were plotted relative to shotpoint location (NAD27 datum, UTM zone 17) at a default map scale set by the software. Depth to the interpreted horizon was plotted next to each shotpoint annotation. An outline of the Florida Keys shoreline was included on the maps using the National Ocean Service Digital Shoreline Dataset. Trackline names, geographic coordinate grid, and a scale bar were superimposed on each map. Digital output files of the maps (DXF format) were imported into a drawing program (Adobe Illustrator 7.0) for page-layout manipulation using a GIS translation plug-in called MAPInfo. In Illustrator, the maps were divided into six panels along the length of the GIS. Each panel was then scaled up to a page width of approximately 42 inches, which corresponded to a map scale of about 1:24,000. Finally, hardcopies of the maps were generated using a large-format plotter. Contouring the data points was accomplished on mylar overlays referenced to latitude and longitude. |

![]() U.S. Department of the Interior |
U.S. Geological Survey
U.S. Department of the Interior |
U.S. Geological Survey
URL: [disc] /pubs/pp/2007/1751/professional-paper/data-acquisition.html
Page Contact Information: Feedback
Page Last Modified: December 01, 2016 @ 04:11 PM (JSS)