 |
Figure 1. Cape Cod and the islands and the study area off Martha's Vineyard, Massachusetts (red polygon). The areas of earlier studies (Poppe and others, 2006; Poppe and others, 2007a; Poppe and others, 2007b; Poppe and others, 2008) completed as part of this series are shown as green polygons. |
 |
Figure 2. Edgartown Harbor, the boundary of the study area (red line), and local physiographic features. |
 |
Figure 3. Regional paleogeographic map showing the extent of the Laurentide ice sheet over Cape Cod and the islands about 20–22 thousand years ago (ka). |
 |
Figure 4. Regional paleogeographic map of Cape Cod and the islands just before 18 thousand years ago (ka). Map shows the extents of the Laurentide ice sheet and Glacial Lake Nantucket Sound. |
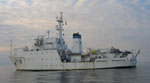 |
Figure 5. Port-side view of the National Oceanic and Atmospheric Administration Ship Thomas Jefferson at sea. The 30-foot survey launch normally stowed on this side of the ship has been deployed. |
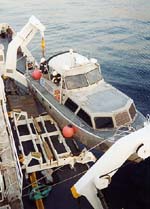 |
Figure 6. The National Oceanic and Atmospheric Administration Launch 1014 being deployed from the NOAA Ship Thomas Jefferson. |
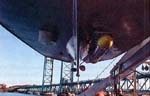 |
Figure 7. A Klein 5000 sidescan-sonar system hull-mounted to a National Oceanic and Atmospheric Administration launch. |
 |
Figure 8. The RESON Seabat 8101 hull-mounted in the keel cut out of National Oceanic and Atmospheric Administration Launch 1005. |
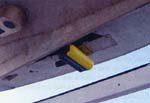 |
Figure 9. The RESON Seabat 8125 hull-mounted in the keel cut out of National Oceanic and Atmospheric Administration Launch 1014. |
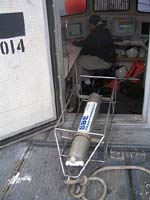 |
Figure 10. Conductivity-temperature-depth (CTD) profiler. Data derived from frequent deployments of this device were used to correct sound velocities for the multibeam data. |
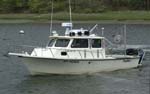 |
Figure 11. A port-side view of the USGS research vessel Rafael that was used to collect Chirp and Boomer seismic-reflection profiles, bottom photography, and sediment samples in the vicinity of Edgartown Harbor, Massachusetts. |
 |
Figure 12. The locations of the tracklines (blue lines) along which the 5 Boomer high-resolution seismic-reflection profiles were collected during cruise 08034 of research vessel Rafael. Also shown are the locations of profile segments shown in figures 25 and 26 (red segments). |
 |
Figure 13. The locations of the tracklines (green lines) along which the 16 Chirp high-resolution seismic-reflection profiles were collected during the August 2008 cruise 08034 of the research vessel Rafael. Also shown are the locations of line segments shown in figures 27 and 28 (red segments). Because lines 1 and 2 were test lines along which the survey did not produce useful data, they are not shown on this map. |
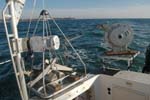 |
Figure 14. The small Seabed Observation and Sampling System (SEABOSS), a modified Van Veen grab equipped with still and video photographic systems, mounted on the aft starboard side of the research vessel Rafael. Note the winch mounted on the davit (left) and the takeup reel for the video-signal and power cable (right). |
 |
Figure 15. Locations of stations at which bottom samples and photographs were taken during cruise 08012 of research vessel Rafael to verify acoustic data. |
 |
Figure 16. Correlation chart showing the relationships among phi sizes, millimeter diameters, size classifications (Wentworth, 1922), and American Society for Testing and Materials and Tyler sieve sizes. Chart also shows the corresponding intermediate diameters, grains per milligram, settling velocities, and threshold velocities for traction. |
 |
Figure 17. Sediment-classification scheme from Shepard (1954), as modified by Schlee (1973). |
 |
Figure 18. Reconnaissance single-beam and multibeam bathymetry collected during National Oceanic and Atmospheric Administration survey H11346. Hotter colors are shallower areas; cooler colors are deeper areas. See key for depth ranges. |
 |
Figure 19. Digital terrain model of the sea floor produced from the single-beam and multibeam bathymetry collected during National Oceanic and Atmospheric Administration survey H11346 and gridded to 25 m. Image is sun-illuminated from 46° and vertically exaggerated 10X. Hotter colors are shallower areas; cooler colors are deeper areas. See key for depth ranges. |
 |
Figure 20. Sidescan-sonar imagery produced from data collected during National Oceanic and Atmospheric Administration survey H11346. Light tones indicate hard returns and generally coarser grained sediments; dark tones indicate softer returns and generally finer grained sediments. |
 |
Figure 21. Interpretation of the sea floor surveyed in National Oceanic and Atmospheric Administration survey H11346. Interpretation includes the locations of buried fluvially cut channels; areas characterized by boulders, sand waves, and shell beds; and the locations of the detailed clips of the sidescan-sonar mosaic shown in figures 22, 23, and 24. |
 |
Figure 22. Detailed planar view of the seaward extension of Middle Flats from the sidescan-sonar mosaic produced during National Oceanic and Atmospheric Administration survey H11346. View shows high backscatter targets interpreted to be boulders. Location of view is shown in figure 21. |
 |
Figure 23. Detailed planar view of the sidescan-sonar mosaic produced during National Oceanic and Atmospheric Administration survey H11346. View shows relatively straight to sinuous alternating bands of high and low backscatter (tiger-stripe pattern) indicative of transverse sand waves. Location of view is shown in figure 21. |
 |
Figure 24. Detailed planar view of the sidescan-sonar mosaic produced during National Oceanic and Atmospheric Administration survey H11346. View shows the contact between areas characterized by high backscatter (shell deposits) and low backscatter (fine-grained sand). Location of view is shown in figure 21. |
 |
Figure 25. Segment of Boomer high-resolution seismic-reflection profile and interpretation from research vessel Rafael cruise 08034 line 4 across the elongate bathymetric high that extends seaward from Middle Flats. Coastal-plain deposits underlie the glacial drift. Location of profile is shown in figure 12. |
 |
Figure 26. Segment of Boomer high-resolution seismic-reflection profile and interpretation from RV Rafael cruise 08034 line 4 across the buried channel that extends seaward beneath Edgartown Harbor. Estuarine and transitional deposits fill the buried channel, and some of these deposits contain gas-charged sediment. Location of profile is shown in figure 12. |
 |
Figure 27. Segment of Chirp high-resolution seismic-reflection profile and interpretation from research vessel Rafael cruise 08034 line 3 offshore of Edgartown Beach. The surface of the glacial drift has been fluvially eroded, and topographic lows have been filled by estuarine and transitional deposits. Location of profile is shown in figure 13. |
 |
Figure 28. Segment of Chirp high-resolution seismic-reflection profile and interpretation from research vessel Rafael cruise 08034 line 18 across the buried channel that extends seaward beneath Edgartown Harbor. Some estuarine and transitional deposits consist of gas-charged sediment. Location of profile is shown in figure 13. |
 |
Figure 29. Locations of stations at which sediment samples were collected during cruise 08034 of research vessel Rafael to verify acoustic data. Hotter colors are coarser grained sediment; cooler colors are finer grained sediments. See key for sediment classifications. |
 |
Figure 30. Sessile fauna and flora on the bottom at station 18. These organisms commonly cover boulders in high-energy environments. Station location is shown in figures 15 and 29. |
 |
Figure 31. The flat, sandy bottom at station E9. This flat, sandy sea floor is typical of the deeper offshore waters in the western part of the study area. Note the presence of animal tracks and burrows. Station location is shown in figures 15 and 29. |
 |
Figure 32. The bottom at station E31. This undulating to faintly rippled sandy sea floor is typical of the deeper offshore waters in the eastern part of the study area. Note the presence of burrows. Station location is shown in figures 15 and 29. |
 |
Figure 33. The bottom at station E26. This flat, muddy sea floor is typical of the inner part of Edgartown Harbor. Note the presence of animal tracks, a spider crab, and dead eelgrass. Station location is shown in figures 15 and 29. |
 |
Figure 34. The dense slippersnail (Crepidula) shell bed on the bottom at station E16 off the tip of the seaward extension of Middle Flats. Note growth on the shells. Station location is shown in figures 15 and 29. |
 |
Figure 35. The slippersnail (Crepidula) shell bed on the bottom at station E22 northeast of the tip of the seaward extension of Middle Flats. Station location is shown in figures 15 and 29. |
 |
Figure 36. The slippersnail (Crepidula) shell bed on the bottom at station E10 northwest of the tip of the seaward extension of Middle Flats. Note the veneer of sediment on the shells. Station location is shown in figures 15 and 29. |
 |
Figure 37. The dense stands of seaweed that grow on the flanks and crest of the seaward extension of Middle Flats at station E17. Station location is shown in figures 15 and 29. |
 |
Figure 38. The dense stands of seaweed that grow on the flanks and crest of the seaward extension of Middle Flats at station E13. Station location is shown in figures 15 and 29. |


