
|
List of Figures
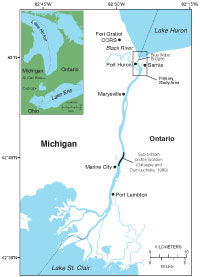 |
Figure 1. Map showing the St. Clair River, which flows from Lake Huron to Lake St. Clair between Michigan and Ontario, Canada. The primary study area is the northernmost part of the river. Two site-specific survey areas—Marysville, MI, and Port Lambton, Ontario—also are shown. The Fort Gratiot CORS (Continually Operated Reference Station) was used to post process navigation to RTK positions (National Geodetic Survey, 2009). |
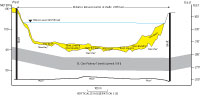 |
Figure 2. Geologic section at the site of the old railway tunnel under the St. Clair River that was completed in 1891 (modified from Gilbert, 1991). The section was based on 110 cores collected in 1888, spaced 20 ft (about 6 m) apart along the line of the tunnel, and 11 test borings, made 50 ft (about 15 m) south of the tunnel (See fig. 10 for location of section. Vertical scale is elevation above sea level, datum unknown.) |
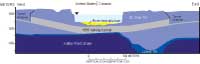 |
Figure 3. Geologic section along new (completed in 1995) railway tunnel under the St. Clair River (modified from Finch, 1996). The section was based on 32 boreholes under the river and 30 additional boreholes on land. (See fig. 10 for location of section. Vertical scale is elevation above sea level, datum unknown.) |
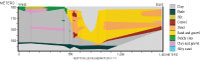 |
Figure 4. Borehole transect (9 boreholes) in the vicinity of the Blue Water Bridges (U.S. Geological Survey, unattributed section available at the USGS Michigan Water Science Center). (See fig. 10 for location of transect. Vertical scale is elevation above sea level, datum unknown.) |
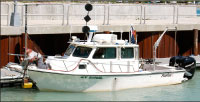 |
Figure 5. U.S. Geological Survey RV Rafael with 234-kHz SWATHplus® transducers mounted on the bow. (Photograph by D. Foster, U.S. Geological Survey) |
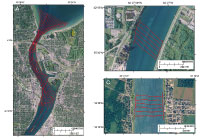 |
Figure 6. Maps along which Chirp sub-bottom and SWATHplus® data were collected: (A) in the northernmost St. Clair River area (sidescan-sonar data also were collected along shore-parallel tracklines); (B) at Marysville, MI; and (C) at Port Lambton, Ontario. Tracklines are shown in red. (2005 orthophoto base from Michigan State University, Remote Sensing & GIS Research and Outreach Services, USDA-FSA Aerial Photography Field Office.) |
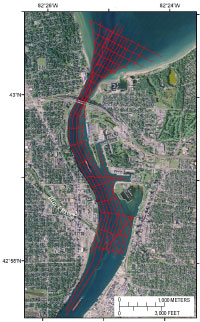 |
Figure 7. Map showing tracklines (red) where Boomer sub-bottom data were collected in the northernmost St. Clair River area. Tracklines are shown in red. (2005 orthophoto base from Michigan State University, Remote Sensing & GIS Research and Outreach Services, USDA-FSA Aerial Photography Field Office.) |
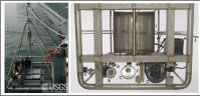 |
Figure 8. The U.S. Geological Survey Mini SEABOSS, shown (left) being deployed from the RV Rafael was used to collect sediment samples, video, and digital photographs. The Mini SEABOSS components viewed from below (right) are: (A) forward video camera; (B) downward video camera; (C) video light; (D) digital still camera and housing; (E) strobe light; (F) parallel lasers for scale; (G) laser for ranging; (H) junction block; (I) Van Veen grab sampler; (J) multi-conducting cable. (Photographs by D. Blackwood, U.S. Geological Survey.) |
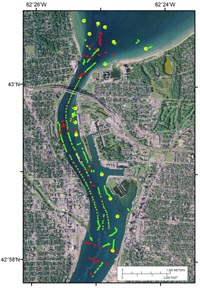 |
Figure 9. Map showing location and tracklines of video drifts (red lines), locations of individual digital still photographs (green dots), and sediment-sampling locations (yellow dots) for data acquired with the Mini SEABOSS in the St. Clair River. The red dots show locations of selected observations of video along video transects from Krishnappan (2009). (2005 orthophoto base from Michigan State University, Remote Sensing & GIS Research and Outreach Services, USDA-FSA Aerial Photography Field Office.) |
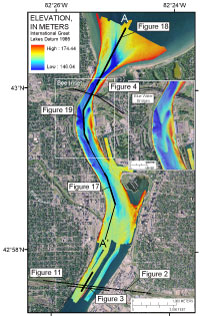 |
Figure 10. Bathymetric map of the northernmost St. Clair River study area. Locations of sub-bottom profile figures (bold black lines) and geologic sections (narrow black lines) are shown. Section A-A’ (fig. 12) was constructed from interpretation of the sub-bottom profiles. Inset map shows detail of linguoid bars south of the Blue Water Bridges. (2005 orthophoto base from Michigan State University, Remote Sensing & GIS Research and Outreach Services, USDA-FSA Aerial Photography Field Office.) |
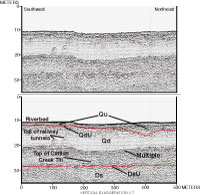 |
Figure 11. Boomer sub-bottom profile that crosses over the railway tunnels in the northernmost St. Clair River area with seismic stratigraphic interpretation. Vertical scale is depth in meters (zero depth is 175.9 m IGLD 1985 based on water level, at the time of data acquisition, at the NOAA gage at the mouth of the Black River), using a sound velocity of 1,450 m/s in water and 1,650 m/s in sediment. (See table 1 for explanation of stratigraphic units and unconformities; see fig. 10 for profile location.) |
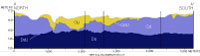 |
Figure 12. Geologic section A-A’ showing the major seismic stratigraphic units and unconformities in the northernmost St. Clair River area. Vertical scale is elevation in meters IGLD 1895. Vertical black lines show bends in the section. (See table 1 for explanation of stratigraphic units and unconformities; see fig. 10 for cross section location.) |
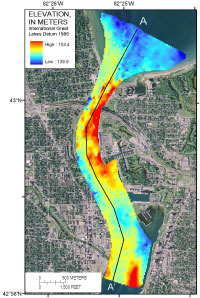 |
Figure 13. Elevation (IGLD 1985) of bedrock surface (DsU) in the northernmost St. Clair River area. The black line shows the location of the geologic section A-A’ (fig. 12). Grid-cell size is 20 m x 20 m. (2005 orthophoto base from Michigan State University, Remote Sensing & GIS Research and Outreach Services, USDA-FSA Aerial Photography Field Office.) |
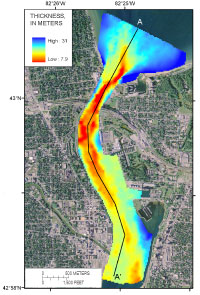 |
Figure 14. Total Quaternary sediment thickness (Qd and Qu combined) in the northernmost St. Clair River area. The black line shows the location of the geologic section A-A’ (fig. 12). Grid-cell size is 20 m x 20 m. (2005 orthophoto base from Michigan State University, Remote Sensing & GIS Research and Outreach Services, USDA-FSA Aerial Photography Field Office.) |
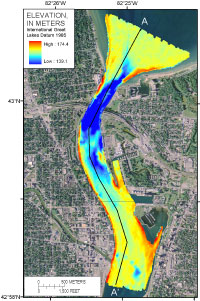 |
Figure 15. Elevation of the top of Quaternary glacial drift (QdU) in the northernmost St. Clair River area. The black line shows the location of the geologic section A-A’ (fig. 12). Grid-cell size is 20 m x 20 m. (2005 orthophoto base from Michigan State University, Remote Sensing & GIS Research and Outreach Services, USDA-FSA Aerial Photography Field Office.) |
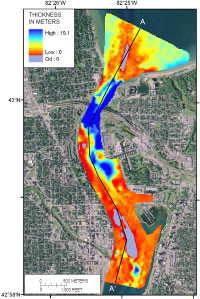 |
Figure 16. Thickness of Quaternary undifferentiated glaciofluvial, glaciolacustrine, fluvial, and lacustrine deposits (Qu) in the northernmost St. Clair River area. Qu is absent where Quaternary glacial drift (Qd) is exposed at the surface (purple area). The black line shows the location of the geologic section A-A’ (fig. 12). Grid-cell size is 20 m x 20 m. (2005 orthophoto base from Michigan State University, Remote Sensing & GIS Research and Outreach Services, USDA-FSA Aerial Photography Field Office.) |
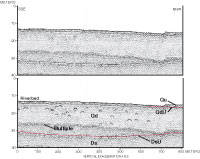 |
Figure 17. Boomer sub-bottom profile showing hyperbolic reflections within Quaternary glacial drift (Qd) in the northernmost St. Clair River area that are interpreted to be cobbles, boulders, and coarse-sediment lenses. The undifferentiated Quaternary unit (Qu) pinches out, exposing Qd at the riverbed. Vertical scale is depth in meters (zero depth is 175.9 m IGLD 1985 based on water level, at the time of data acquisition, at the NOAA gage at the mouth of the Black River), using a sound velocity of 1,450 m/s in water and 1,650 m/s in sediment. (See table 1 for explanation of stratigraphic units and unconformities; see fig. 10 for profile location.) |
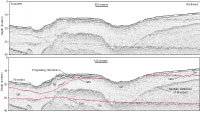 |
Figure 18. Boomer sub-bottom profile showing the seismic stratigraphy where Lake Huron meets the head of the St. Clair River. Vertical scale is depth in meters (zero depth is 176.0 m IGLD 1985 based on water level, at the time of data acquisition, at the NOAA gage at Fort Gratiot), using a sound velocity of 1,450 m/s in water and 1,650 m/s in sediment. (See table 1 for explanation of stratigraphic units and unconformities; see fig. 10 for profile location.) |
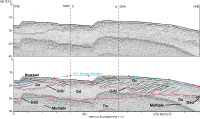 |
Figure 19. Boomer sub-bottom profile showing the seismic stratigraphy beneath two linguoid bars in the northernmost St. Clair River area. The blue line represents the elevation of the riverbed in 1971 as derived from individual sounding points (red dots). Vertical scale is depth in meters (zero depth is 175.9 m IGLD 1985 based on water level, at the time of data acquisition, at the NOAA gage at Dunn Paper), using a sound velocity of 1,450 m/s in water and 1,650 m/s in sediment. (See table 1 for explanation of stratigraphic units and unconformities; see fig. 10 for profile location.) |
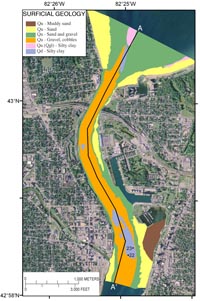 |
Figure 20. Surficial geology of the northernmost St. Clair River area based on the interpretation of acoustic-backscatter (fig. 21) and video, photographs, and sediment sample information (fig. 9). The major seismic stratigraphic units (Qd and Qu) are divided on the basis of surficial sediment type. Locations of bottom photographs in figures 22 and 23 are shown. The black line shows the location of the geologic section A-A’ (fig. 12). (2005 orthophoto base from Michigan State University, Remote Sensing & GIS Research and Outreach Services, USDA-FSA Aerial Photography Field Office.) |
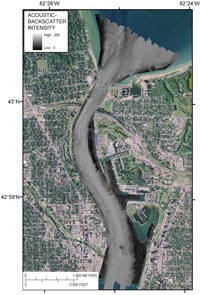 |
Figure 21. Map showing SWATHplus®-processed acoustic backscatter intensity in the northernmost St. Clair River area. Dark areas are lower backscatter and light are higher backscatter. (2005 orthophoto base from Michigan State University, Remote Sensing & GIS Research and Outreach Services, USDA-FSA Aerial Photography Field Office.) |
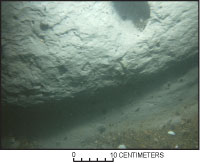 |
Figure 22. Photograph showing a ledge of glacial till exposed at the riverbed in the northernmost St. Clair River area. Apparently, the till has been scoured and undercut. The void at the upper shows where a clast about 10 cm in diameter has been eroded from the till. (See fig. 20 for the location of this photograph; photograph by D. Foster, U.S. Geological Survey.) |
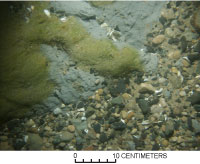 |
Figure 23. Photograph showing glacial till exposed at the riverbed in the northernmost St. Clair River area, with areas of plant growth and a coarse lag deposit. (See fig. 20 for the location of this photograph; photograph by D. Foster, U.S. Geological Survey.) |
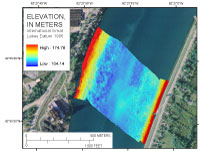 |
Figure 24. Bathymetric map of the area at Marysville, MI. (2005 orthophoto base from Michigan State University, Remote Sensing & GIS Research and Outreach Services, USDA-FSA Aerial Photography Field Office.) |
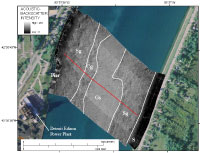 |
Figure 25. Acoustic-backscatter (processed from SWATHplus®) map for transect across the river at Marysville, MI. Red line shows the location of the Chirp sub-bottom profile shown in figure 26. S, area of low backscatter (dark), which is probably sand; Sg, moderate backscatter area, which is likely sand and gravel; Gs, high backscatter (light) area with dune bedforms (3- to 5-meter wavelengths), mostly gravel with sand; Cg, mottled area of high to low backscatter, which is most likely areas of clay till or glaciolacustrine with patches of gravel. Interpretations based on video transect obtained 500 m to the south (Krishnappan, 2009). |
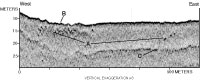 |
Figure 26. Chirp profile near Marysville, MI (see fig. 25 for location): A, areas of coarse material, probably cobbles and boulders, within clay till; B, area of glacial till exposed at the riverbed; C, first multiple reflection of riverbed. Vertical scale is depth in meters (zero depth is 175.5 m IGLD 1985 based on water level, at the time of data acquisition, at the NOAA Dry Dock gage), using a sound velocity of 1,450 m/s in water and 1,650 m/s in sediment. |
 |
Figure 27. Bathymetric map of the area at Port Lambton, Ontario. (2005 orthophoto base from Michigan State University, Remote Sensing & GIS Research and Outreach Services, USDA-FSA Aerial Photography Field Office.) |
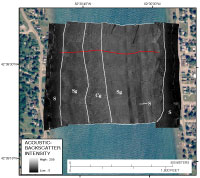 |
Figure 28. Acoustic-backscatter (processed from SWATHplus®) map for transect at Port Lambton, Ontario. Red line shows the location of the Chirp sub-bottom profile shown in figure 29. (S) area of low backscatter (dark), which is probably sand; Sg, moderate backscatter area, which is likely sand and gravel; Cg, mottled area of high to low backscatter, which is most likely areas of clay till or glaciolacustrine with patches of gravel. (2005 orthophoto base from Michigan State University, Remote Sensing & GIS Research and Outreach Services, USDA-FSA Aerial Photography Field Office.) |
 |
Figure 29. Chirp profile at Port Lambton, Ontario (see fig. 28 for location): A, lens of sediment deposited in the channel thalweg; B, buried fluvial channel surface; C, first multiple reflection of riverbed. Vertical scale is depth in meters (zero depth is 175.2 m IGLD 1985 based on water level, at the time of data acquisition, at the Canadian Hydrographic Service gage at Port Lambton), using a sound velocity of 1,450 m/s in water and 1,650 m/s in sediment. |
List of Tables
 |
Table 1. Stratigraphic column for the northernmost St. Clair River area (Morris, 2008), with correlations to seismic stratigraphic units Devonian shale (Ds), Quaternary glacial drift (Qd), and Quaternary undifferentiated (Qu). Qu includes glaciofluvial, glaciolacustrine, fluvial, and lacustrine deposits. Major unconformities are the top of Devonian shale (DsU) and the top of glacial drift (QdU). |
|

